Movies
UndStdLeakyMode
Movies
Back
Figure 4
Wave propagation in a uniform medium. Light is injected into a uniform medium at z = 0. The movie shows the real part of the electric field.

Figure 7
Wave propagation in a three-layer waveguide. The light is injected into the waveguide at z = 0. The movie shows the real part of
the electric field. The black dashed lines indicate x = ±a.
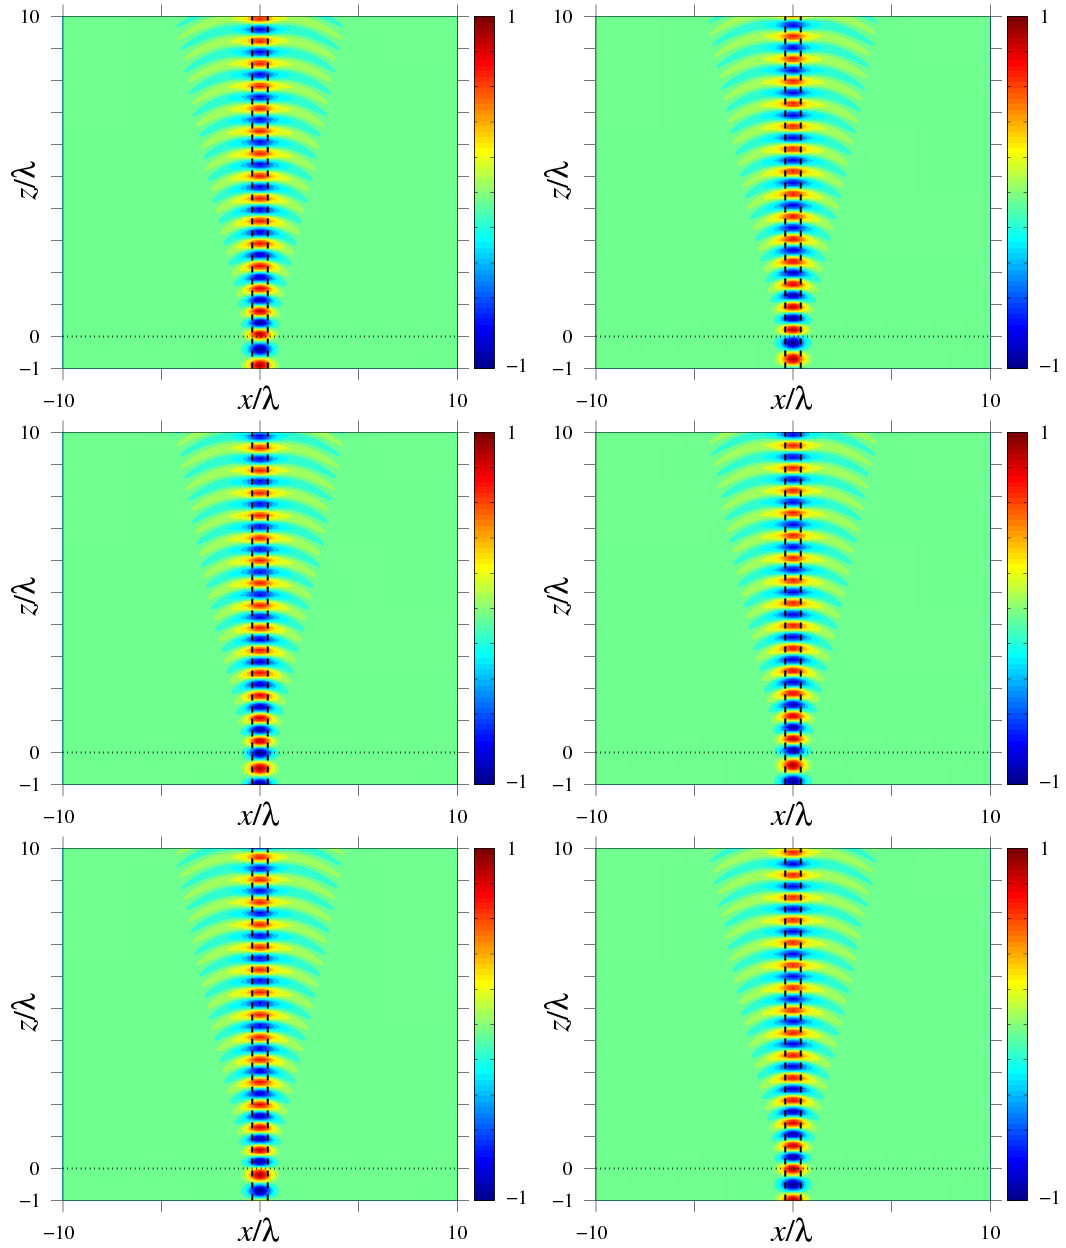
Figure 12
Wave propagation in a W-type waveguide. Light is injected into the W-type waveguide at z = 0. The black dash-dotted lines and black dashed lines indicate x = ±a and x = ±b, respectively. The movie shows the real part of the electric field.

Figure 14
Movie of the transverse mode evolution as the mode propagates along a W-type slab waveguide. The red dashed curve and blue solid curve represent the transverse mode power from the leaky mode and the actual profile that is found by integrating Eq. 4. The black dashed lines indicate x = ±b.
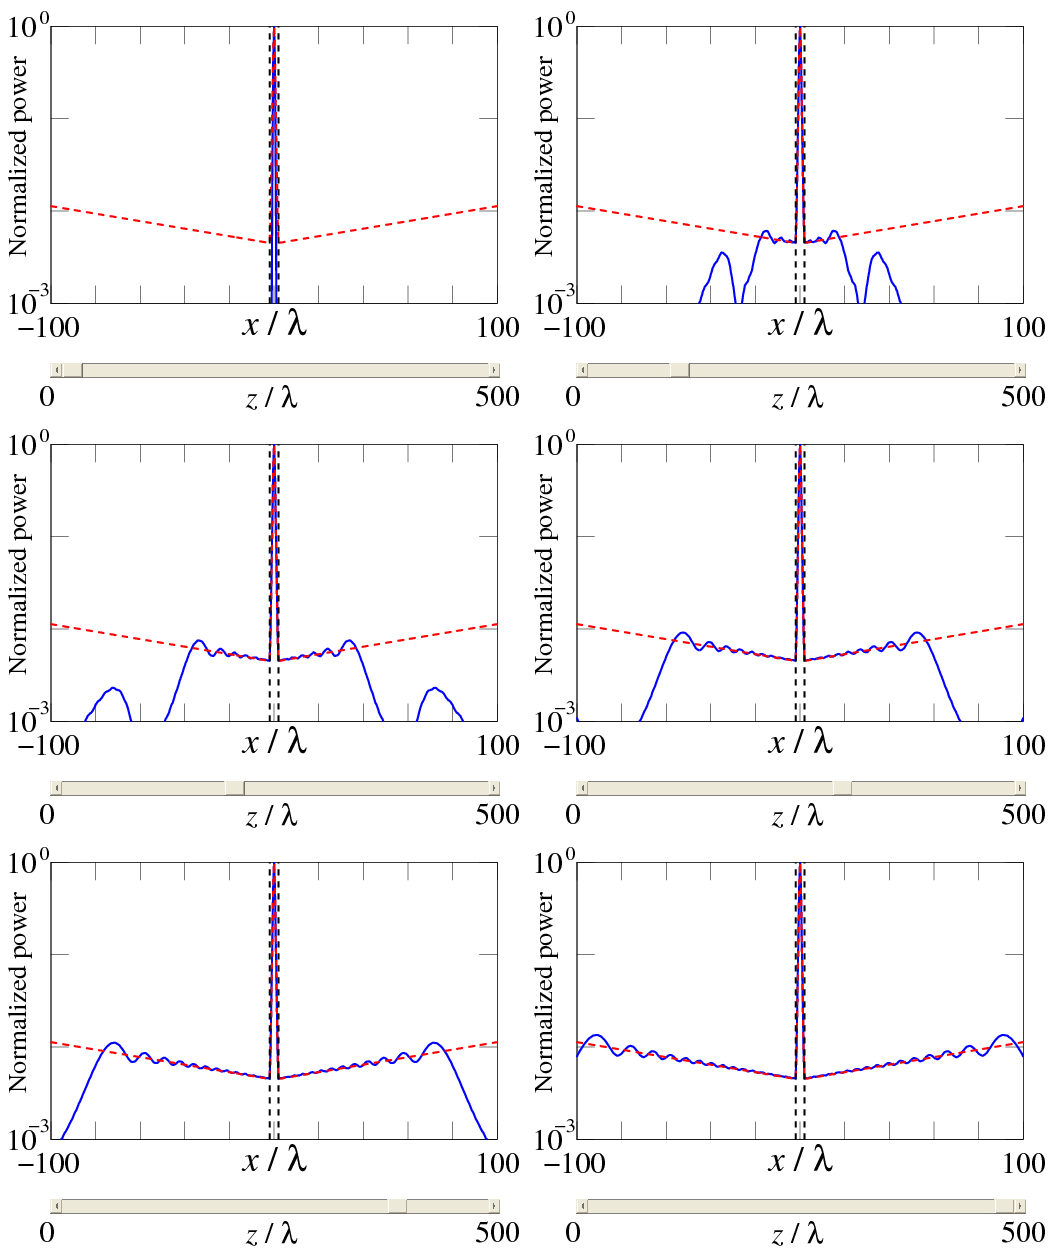
Figure 20
Wave propagation in a leaky bandgap waveguide. A beam is injected into the waveguide at z = 0. The movie shows the real part of
the electric field. The black dash-dotted lines and black dashed lines indicate x = ±d and x = ±(d+ML), respectively.
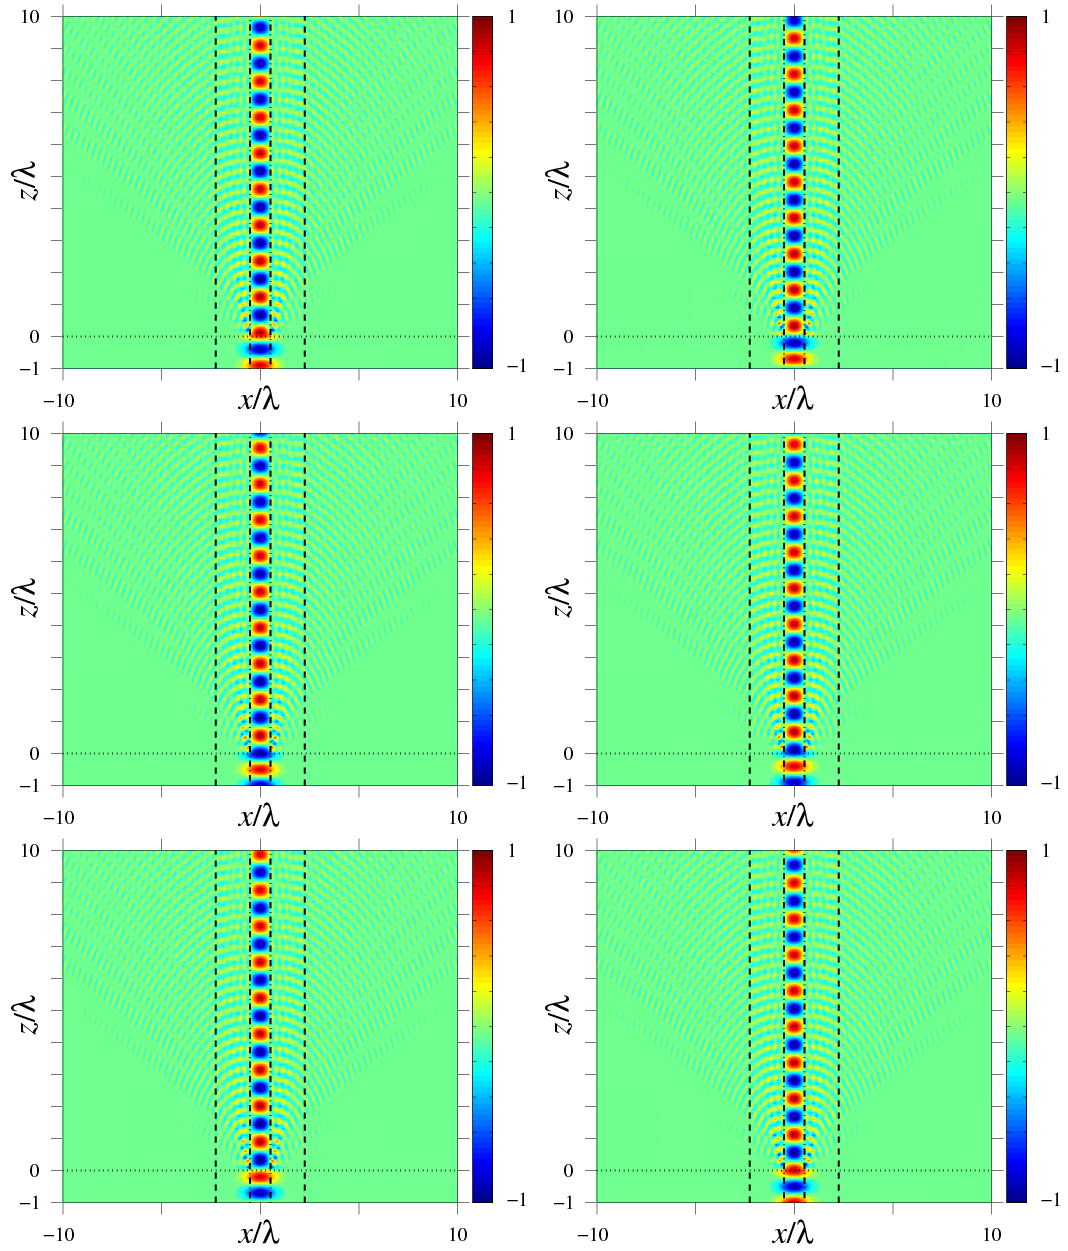
Figure 21
Movie of the transverse mode evolution as it propagates along a leaky bandgap slab waveguide. The red dashed curve and blue solid curve represent the power of the leaky mode and the computational solution of Eq. 4. The boundary lines are not shown in this figure since they are very close to the center, as shown in Fig. 20.
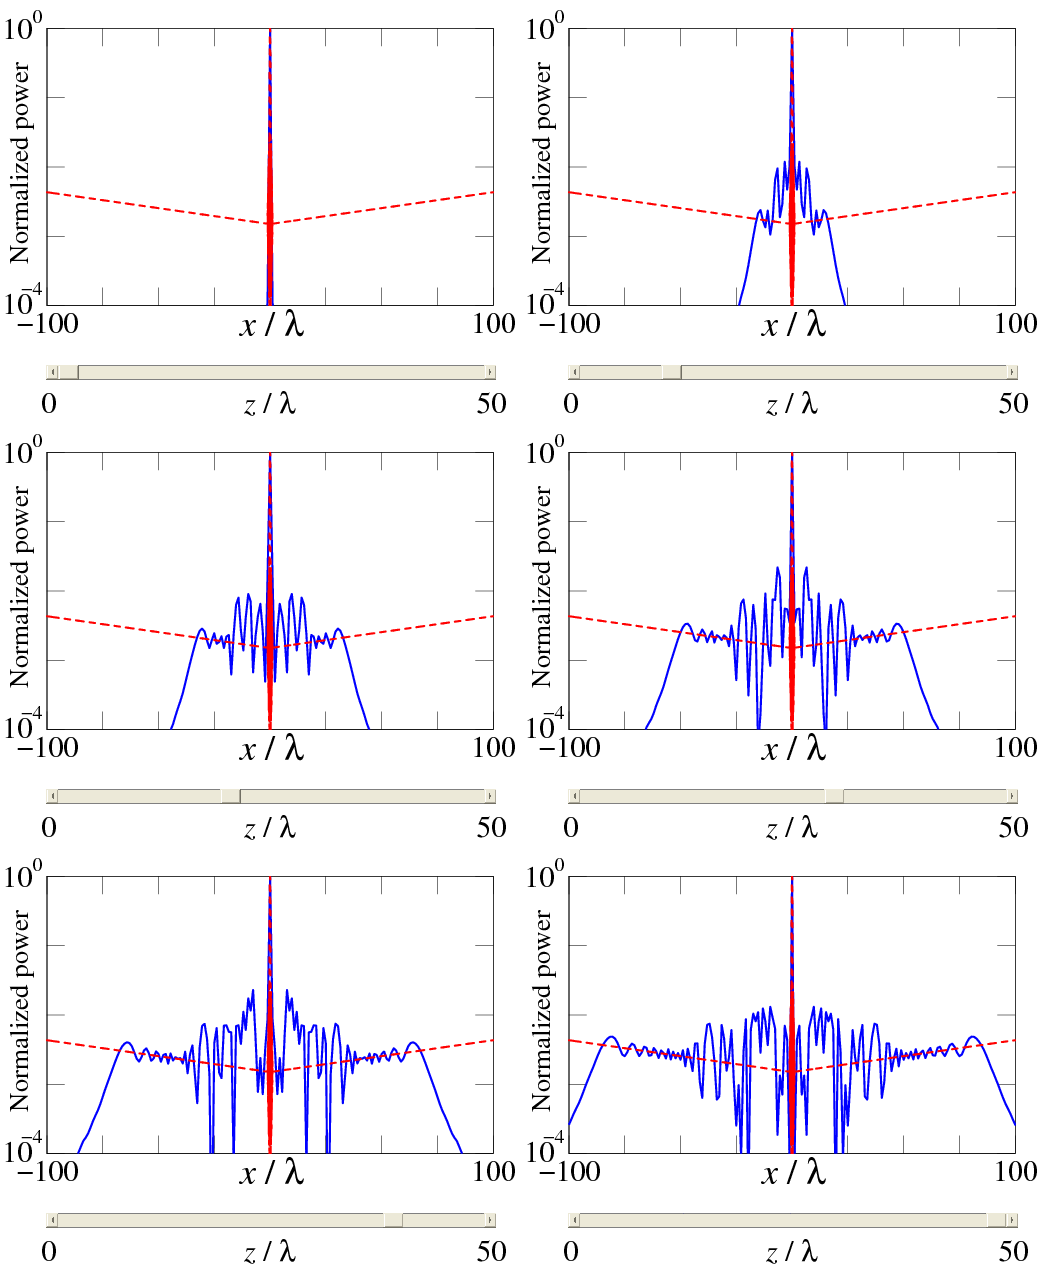
Figure 28
Movie of the transverse normalized power of the same initial Gaussian beam that we considered in Sec. 4.4.We also show the power of the leaky mode as a red dashed curve. We have normalized the peak of the mode power profiles to 1. The black dash-dotted lines, black dashed line, and black dotted lines indicate x=±a, x=±b, and x=±L, respectively.
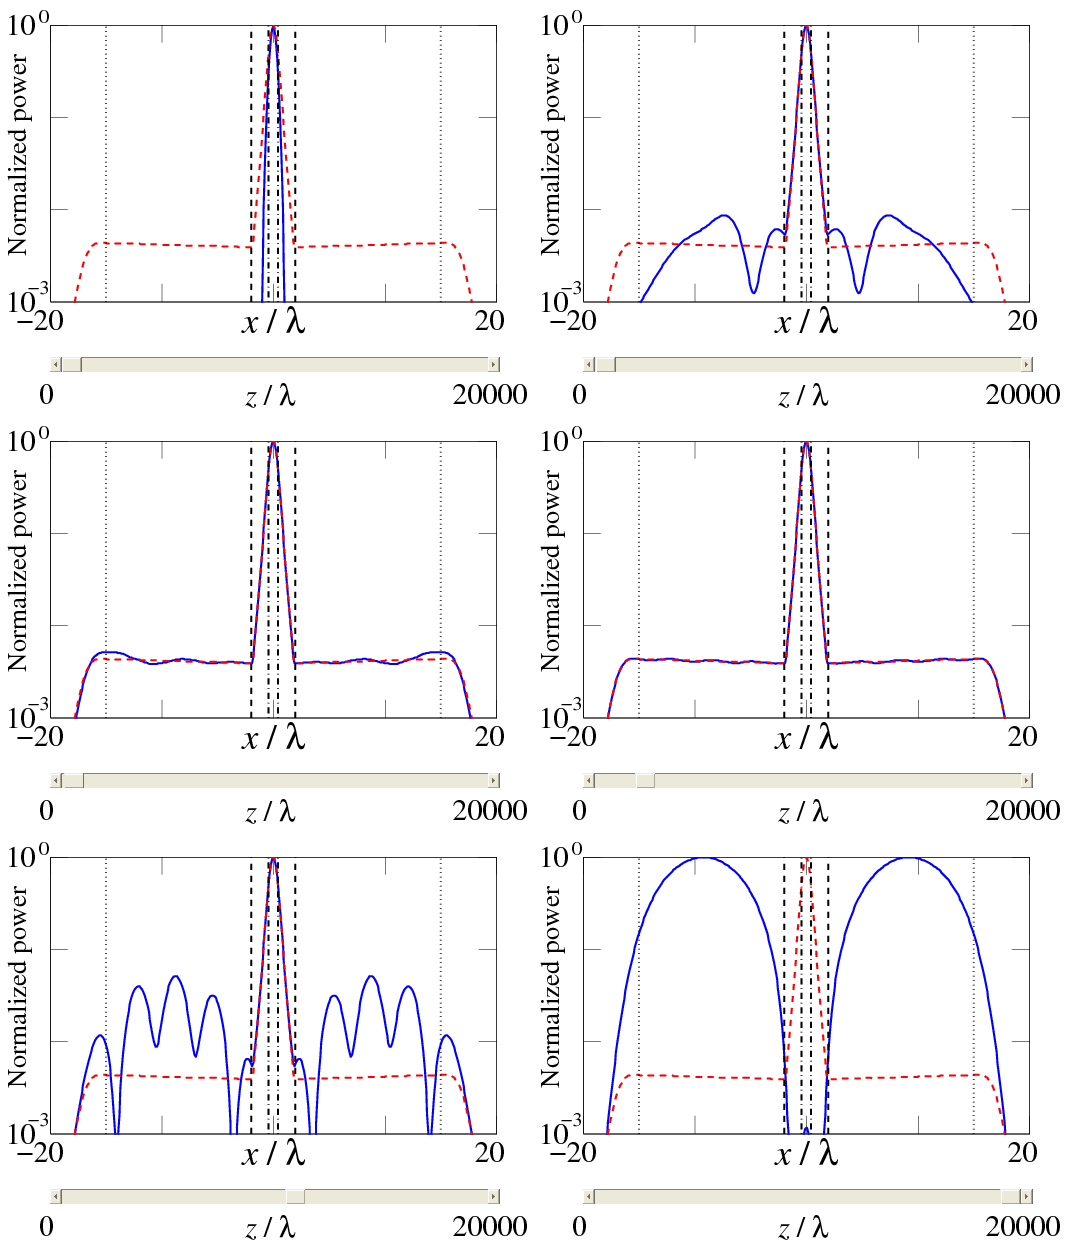
Figure 30
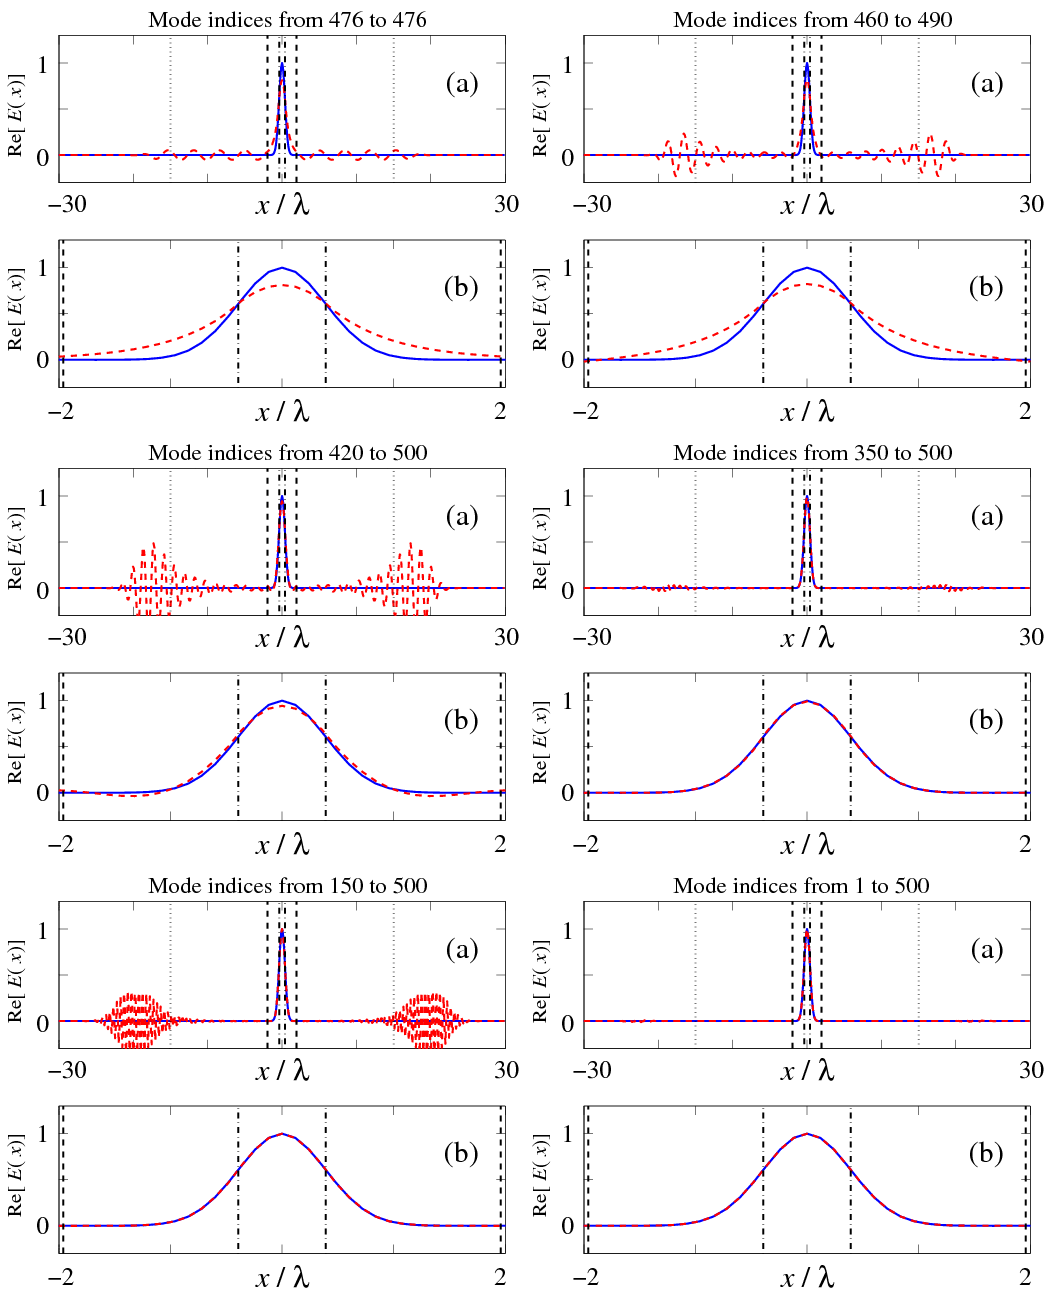
Slide show for the input wave (blue solid curves) and its decomposition into the eigenmodes (red dashed curves). In (b), we show the central region from (a). The black dash-dotted lines, black dashed line, and black dotted lines indicate x = ±a, x = ±b, and x = ±L, respectively.
Documentation
|


